The American Home: How Ownership Built (and Bypassed) Generational Wealth

For over a century, owning a home has been the single most powerful path to building wealth for American families. It's been more than just shelter, it's been about equity, leverage, and a family LEGACY.
How Homeownership Built Generational Wealth
Since the early 20th century, U.S. economic policy has explicitly rewarded homeownership. Federal mortgage subsidies, tax deductions for mortgage interest, and capital gains exclusions on primary residences helped transform homes into financial engines for the middle class.
By the 1950s, thanks to the G.I. Bill and the rise of the 30-year fixed mortgage, millions of American families were able to buy homes with little money down and low interest rates. Unlike cars or clothes or even stocks, homes not only appreciated—they became a way for families to pass down wealth to the next generation.
That wealth—locked into a house—could later be tapped to pay for education, start a business, or help the next generation buy a home of their own.
Who Was Left Out—and Why
But the promise of wealth through ownership wasn't extended to everyone. Black Americans, immigrant groups, and others were systematically locked out of the housing market at critical times through:
Redlining: Federal housing authorities drew maps that labeled Black and immigrant neighborhoods as too “risky” for mortgage lending.
Racially restrictive covenants: Deeds explicitly barred non-white families from purchasing homes in many suburbs.
Discrimination in FHA lending and GI Bill benefits: Though technically race-neutral, these programs were administered in ways that overwhelmingly benefited white families.
The result was White families built equity and stability in appreciating homes and many Black and Brown families were forced into renting paying someone else’s mortgage while missing out on decades of wealth accumulation or paying greater than market rate for the few homes they could purchase.
To this day, homeownership gaps persist. In 2023, about 75% of white families owned homes, compared to just 44% of Black families—a disparity that mirrors and reinforces the racial wealth gap.
Examples of racially restrictive covnents in Portland:
1. Laurelhurst (1913)
A covenant in this then-premium development declared:
“… nor shall the same or any part thereof be in any manner used or occupied by Chinese, Japanese or negroes, except that persons of said races may be employed as servants by residents.”Wikipedia
2. Mock's Crest, Ferncrest, Palatine Hill (1920s–’30s)
PSU historian Greta Smith identified multiple deed-based restrictions:
“no part of this land shall be used or occupied by any Italians, Greeks, Hindus, Armenians or Indians, except that persons of said races may be employed thereon as servants.” OPB
Another covenant states:
“… No Negroes, Chinese, Japanese, Orientals, or any person other than the Caucasian race shall rent, purchase, occupy or use … any building on any lot …”Multco
3. Dixon Place / Mock’s Crest (1911–1921)
Multnomah County Library archives include a plat with the covenant stipulating no occupancy by “non-white” peopleWikipedia.
Mapping Inequality: How the Government Drew the Lines

In the 1930s, during the Great Depression, the federal government stepped in to stabilize the collapsing housing market. One of the tools created was the Home Owners’ Loan Corporation (HOLC)—a New Deal agency designed to refinance troubled mortgages and restore confidence in lending.
But to decide which neighborhoods were “safe” for long-term investment, the HOLC developed Residential Security Maps for over 200 cities—including Portland. These maps, created between 1935 and 1940, graded neighborhoods into four categories:
Grade A (green) – “Best”
These neighborhoods were considered prime lending territory.
Typically all-white, middle- to upper-income, with newer housing stock.
Residents had stable employment and homeownership rates.
Banks and the FHA were eager to issue loans here.
Mortgage terms were favorable: low interest rates, long repayment periods, and minimal scrutiny.
Effect: These areas saw rapid homeownership growth and high appreciation over time
Grade B (blue) – “Still Desirable”
These areas were seen as stable but slightly less ideal than Grade A.
Still predominantly white, but sometimes included older homes or working-class residents.
Viewed as a “safe bet,” though sometimes flagged for “potential encroachment” from lower-rated areas.
Effect: Loans were still readily available, but lenders might be slightly more conservative on appraisals or terms.
Grade C (yellow) – “Definitely Declining”
These neighborhoods were considered risky, often due to older housing, immigrant populations, or proximity to industrial areas.
Described in HOLC files as having “undesirable elements” or signs of physical decline.
Even if families were employed and homes were well-kept, these areas carried a stigma.
Effect: Loans were harder to get, required higher down payments, and had shorter terms or higher rates.
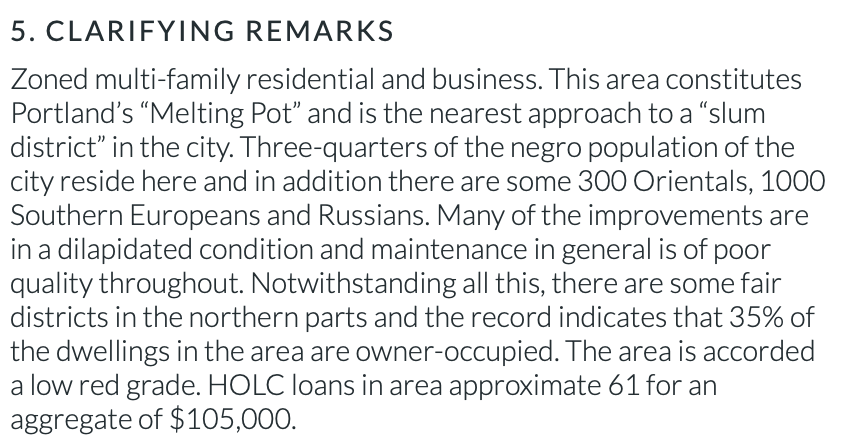
Grade D (red) – “Hazardous”
These areas were often home to Black families, immigrants, or low-income renters, and were almost always labeled as financially toxic.
HOLC descriptions used overtly racist language, referencing “infiltration” or “racial hazards.”
The red shading made it clear: no lender should do business here.
Effect:Conventional mortgages were nearly impossible to secure.
The FHA would not insure loans in redlined areas.
Homebuyers were forced to rely on predatory contracts, private financing, or avoid purchasing altogether.
Disinvestment followed: declining infrastructure, services, and property values.
The grading was based not just on housing stock or condition—but heavily on racial, ethnic, and economic demographics. Neighborhoods with Black residents, immigrant communities, or working-class renters were typically marked in red.
In Portland, redlined areas included much of Lower Albina and the inner east side, where Black and immigrant families had settled. The HOLC maps described these areas as “infiltrated” or “hazardous”—language steeped in racism and classism.
These maps weren’t just bureaucratic tools. They were adopted and reinforced by:
Banks and mortgage lenders, who refused to issue loans in redlined areas.
The Federal Housing Administration (FHA), which denied mortgage insurance to homes in “D” zones.
City planners and appraisers, who echoed these assessments in zoning and valuation decisions.
The effects were immediate and long-lasting. Entire neighborhoods were cut off from credit, infrastructure investment, and appreciation. Meanwhile, white middle-class families were steered into “green” and “blue” areas with easy access to low-interest, government-backed mortgages.
Though the HOLC was dissolved in 1954 and redlining was officially outlawed by the Fair Housing Act of 1968, the consequences of these maps still echo through Portland and other American cities today. Many of the same neighborhoods marked in red nearly a century ago continue to face higher poverty, lower homeownership, and limited access to generational wealth.
Blockbusting and the Business of Fear
While federal maps and lending policy redlined Black families out of opportunity, some real estate agents found a way to profit from the racism those maps institutionalized. It was called blockbusting—and it happened in Portland just as it did in cities like Chicago, Detroit, and Los Angeles.
Blockbusting was the practice of intentionally stoking white homeowners’ fear that their neighborhood was about to become racially integrated. Real estate agents or speculators would:
Hire Black actors to walk through white neighborhoods or show up to open houses.
Spread rumors that “the Blacks are moving in,” often with urgency and manufactured panic.
Encourage white homeowners to sell quickly and cheaply “before values plummet.”
Turn around and sell those same homes to Black families at inflated prices, often using land-sale contracts or high-interest loans that offered no legal protections.
A 1970 report released by a Baltimore group called “the Activists” concluded that the average markup in neighborhoods experiencing racial change ranged from 80% to 100% higher than in racially homogeneous areas and that these inflated prices comprised a “black tax” imposed on African American would-be homebuyers. Given the bleak housing options these buyers faced, many had no other choice and paid the inflated costs. Blackpast
In Portland, this practice emerged in the 1950s and 1960s, targeting areas near the Albina District. As Portland’s Black population—largely displaced from earlier housing by redlining and urban renewal—sought places to live, blockbusters moved in to exploit both sides of the transaction.
White families, often misled or manipulated, sold low. Black families, locked out of traditional financing, bought high and with few rights.
Contracts and Exploitation
Because banks refused to issue traditional mortgages in formerly redlined neighborhoods, Black Portlanders were often offered “land-sale contracts”—agreements where the buyer didn’t actually own the home until the full amount was paid. One missed payment, and all equity was lost.
These exploitative deals:
Charged far higher interest rates than FHA-backed mortgages.
Offered no equity protection or legal recourse.
Left Black families vulnerable to eviction and foreclosure with no safety net.
The Result: Extraction, Not Equity
Unlike white families in FHA-approved neighborhoods, Black families in Portland’s redlined and blockbusted areas:
Paid more for less.
Accrued less (or no) equity.
Had fewer legal protections.
Faced deteriorating neighborhood conditions—often by design.
Blockbusting wasn’t a side effect of a broken system. It was a profitable business model, exploiting the very policies that had excluded Black families from building wealth for decades.

How It Reshaped Portland: A Legacy That Lasted Decades
The cumulative impact of redlining, blockbusting, and disinvestment left a deep imprint on Portland’s urban geography—especially in inner North and Northeast Portland, where Portland’s Black population was concentrated by policy, not choice.
Concentration and Containment: Albina and Beyond
By the 1950s, the vast majority of Portland’s Black residents lived in or around the Albina District, following forced displacement from areas like Vanport and South Portland—a trend tightly bound to systemic segregation and housing discrimination.
When Vanport flooded in May 1948, roughly 18,000 people were displaced—nearly a third of them Black. With few alternatives, many families settled in Albina, where banks would at least offer limited financing—even if predatory Wikipedia.
By 1960, four out of five Black Portlanders were living in Albina. That’s because redlining, restrictive covenants, discriminatory real estate practices, and urban renewal policies confined them to a shrinking area of the city Oregon History Project.
As the Portland Housing Bureau notes, “Seventy‑three percent of Portland’s Black population … was concentrated in Albina” following the Vanport flood—and those same redlining policies denied them mortgage and home‑improvement loans Smithsonian
While white families were encouraged to move to the suburbs with FHA and VA-backed loans, Black Portlanders were contained in neighborhoods that suffered from:
Underinvestment in infrastructure and services
Limited access to quality education and healthcare
Housing stock in disrepair with few legal protections
Urban Renewal, Freeways, and Further Displacement
Starting in the 1950s, Portland joined cities across the country in a federally funded push for “urban renewal”—a euphemism for large-scale demolition of so-called “blighted” areas. In reality, these programs disproportionately targeted poor and minority neighborhoods.
Key Portland projects included:
The construction of Interstate 5 (1960s), which cut through the heart of Albina, destroying hundreds of homes and physically dividing the community.
The Memorial Coliseum project, which cleared large tracts of Black-owned property in the name of progress.
Emanuel Hospital expansion (1970s), which razed homes and businesses—but much of the promised development never came, leaving vacant land and unkept promises.
These projects didn’t just erase buildings. They stripped families of generational wealth, broke apart community networks, and deepened the city’s racial divide.
The Long Arc of Displacement
By the 1990s and early 2000s, after decades of neglect, property values in North and Northeast Portland began to rise. What followed was a wave of gentrification—another chapter in the displacement story.
This time, rising rents and speculative homebuying priced out longtime Black residents. Many who had struggled to stay through the lean years found themselves unable to remain as the very neighborhoods they had been forced into became desirable real estate.
Today, the Black population in Portland’s historic core has declined sharply, relocated to outer east Portland and surrounding suburbs—often areas with fewer resources, longer commutes, and less political influence.
Still Feeling the Impact
According to the Portland Housing Bureau, more than 10,000 Black residents were displaced from inner North and Northeast Portland between 1990 and 2010.
Neighborhoods once redlined now show significant demographic turnover, while the racial homeownership gap remains wide.
The legacy of redlining and blockbusting is visible not just in maps—but in wealth data, school outcomes, health disparities, and housing access.
Why Did Immigrants Eventually Gain Ground—But Black Americans Did Not?
In the early 20th century, many immigrant groups—Italians, Jews, Irish, Eastern Europeans—were lumped into the same “undesirable” categories as Black Americans in the eyes of lenders and housing authorities. They were often redlined too, denied access to loans, and blocked from buying homes in certain neighborhoods.
But there was a key difference:
Most white immigrants could eventually access “whiteness” in America. Over time, their ethnic difference became less relevant to the mainstream power structure. By mid-century, Italians, Poles, and Jews—once excluded—were increasingly accepted as part of the white middle class. This acceptance brought access to:
Federally backed mortgages through the FHA and VA
Suburban housing developments like Levittown
Union jobs and GI Bill benefits
Full legal access to integrate into white neighborhoods
In contrast, Black Americans remained systemically excluded. Their skin color marked them as “permanently” outside of the dominant group, no matter how long their families had lived in the U.S. Even middle-class Black professionals were denied loans or steered to less desirable housing.
While many immigrant families could buy in, see their equity grow, and pass that advantage to their children, Black families were often confined to areas that saw less appreciation—or were pushed out entirely.
Even when fair housing laws were passed in the late 1960s, the damage was already done. White families had often owned homes for a generation or two, riding waves of postwar appreciation. Black families were only then beginning to access markets—often at higher interest rates and with fewer protections—after decades of exclusion.
Today, that legacy shows up starkly in the numbers:
The median net worth of white households is nearly 10x that of Black households.
Home equity remains the largest asset for most families—and the one that Black households have had the hardest time building.
The Downstream Effects of Inherited Homeownership
Owning a home doesn’t just provide shelter—it sets in motion a long-term wealth engine. Here’s how inherited housing wealth has shaped financial trajectories in the U.S.:
1. Intergenerational Transfers: The Power of the Down Payment
Homeowners are significantly more likely to pass down wealth through:
Direct inheritance of homes, often mortgage-free.
Cash gifts or loans to help children afford down payments.
Financial support for education, small businesses, or emergencies—made possible by home equity.
According to the Federal Reserve’s Survey of Consumer Finances (2022):
White families are five times more likely than Black families to receive an inheritance.
Among inheritances over $50,000, the majority involve real estate assets.
This cycle reinforces inequality: families who got in early keep passing that advantage forward.
2. Better Educational and Career Opportunities
Home equity often funds private school tuition, college, or relocation to higher-opportunity areas. Children in home owning families are more likely to:
Attend better-funded schools (due to property tax funding).
Pursue higher education without debt.
Access professional networks in more stable communities.
3. Neighborhood Stability and Political Clout
Homeownership is linked to:
Greater political participation (voter turnout, local organizing).
Increased wealth accumulation through neighborhood appreciation.
Zoning and policy influence, often used to maintain property values—frequently at the cost of inclusion or affordability.
In short, those with inherited homeownership often live in places where wealth begets more wealth.
The Home as a Mirror of American Policy?
America’s housing system reflects its values: property as power, ownership as success, and wealth as something you can pass on—if you can get in the door.
Understanding how that system was built, who it left behind, and how it continues to shape economic choices today is key to any honest conversation about equity and opportunity in America.
References
Brookings Institution. (2020). Why America’s Black-White wealth gap persists.
Federal Reserve Board. (2022). Survey of Consumer Finances (SCF).
Freund, D. M. P. (2007). Colored Property: State Policy and White Racial Politics in Suburban America. University of Chicago Press.
Pew Research Center. (2017). Americans’ complex views on inheritance.
Rothstein, R. (2017). The Color of Law: A Forgotten History of How Our Government Segregated America. Liveright Publishing.
Sugrue, T. J. (1996). The Origins of the Urban Crisis: Race and Inequality in Postwar Detroit. Princeton University Press.
Serbulo, Leanne Claire. Small Steps on the Long Journey to Equality: A Timeline of Post‑Legislation Civil Rights Struggles in Portland, Oregon Historical Quarterly, Vol. 119, No. 3 (Fall 2018). PDF
Gibson, Karen J. Bleeding Albina: A History of Community Disinvestment, 1940–2000, in Bleeding Albina: A History of Community Disinvestment, 1940–2000 (2012). PDF